Fantastic work!Here's a datafile for 2024 Sport Mode since the TM seems to be used more, and the HVB is certainly attempted to be kept charged up better when not being used (not in this data though).
This was actually part of a coast down test to compare modes for regen (still working on making a post about it).
So I wasn't going flat out acceleration (pedal only at 44% max), rather I just wanted to be at 60 mph at a certain point so all the coasts were over the same ground.
Steps: Turned to Sport Mode (ICE off when stopped of course), turned on logging, foot off brake so ICE on, jammed pedal.
So 16 sec almost, so not getting max values here. I'll have to find a road to do that and log it.
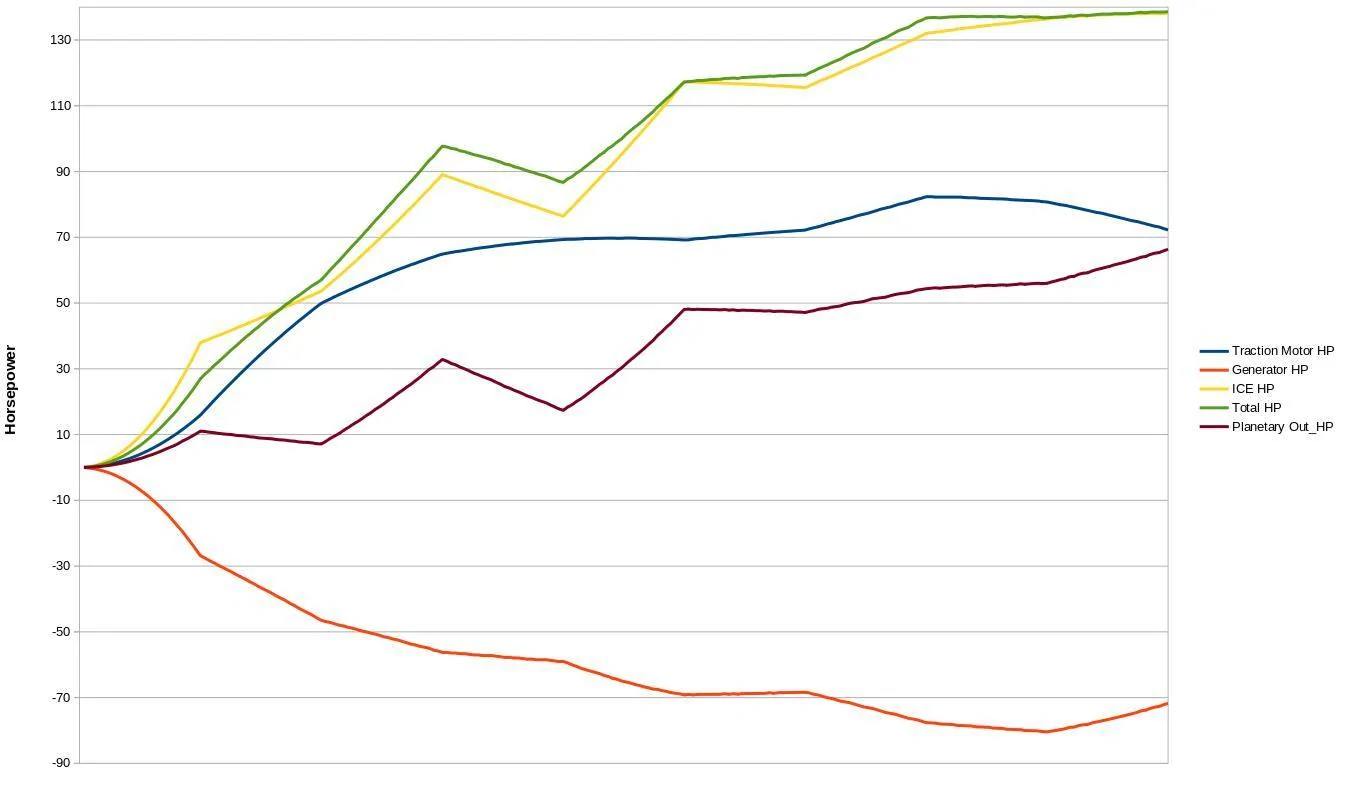
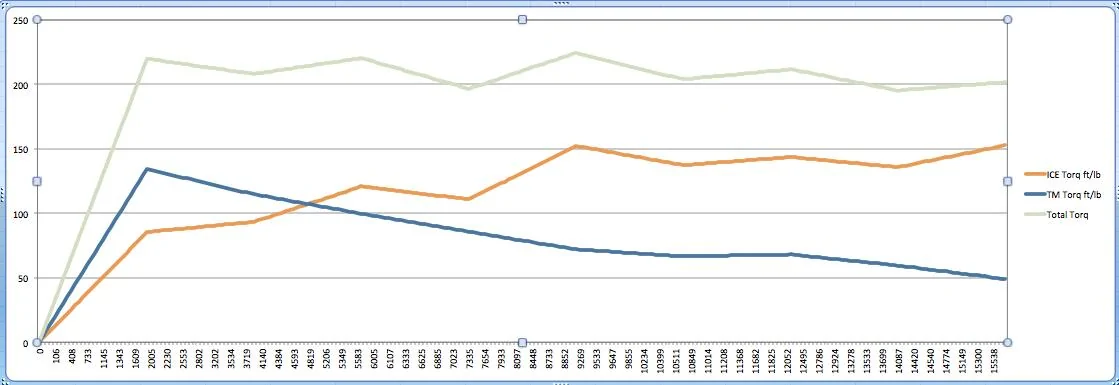
Graph of torque curve for time.
So perhaps telling enough.
Oh - why not a smooth ICE curve?
Sport Mode, the simulated shifts with a real change of ICE RPM with change of Generator Motor RPM so actual "gear" change.
There's an extra graph in the attached data file if desired to see anything else.
Like HVB Amps staying strong the whole 16 sec, GM torq/RPM changes, DCDC Conv Hi Amp changes.
Sponsored