- Thread starter
- Banned
- #1
This first page will be updated regularly with Actual Observed Values reported by members.
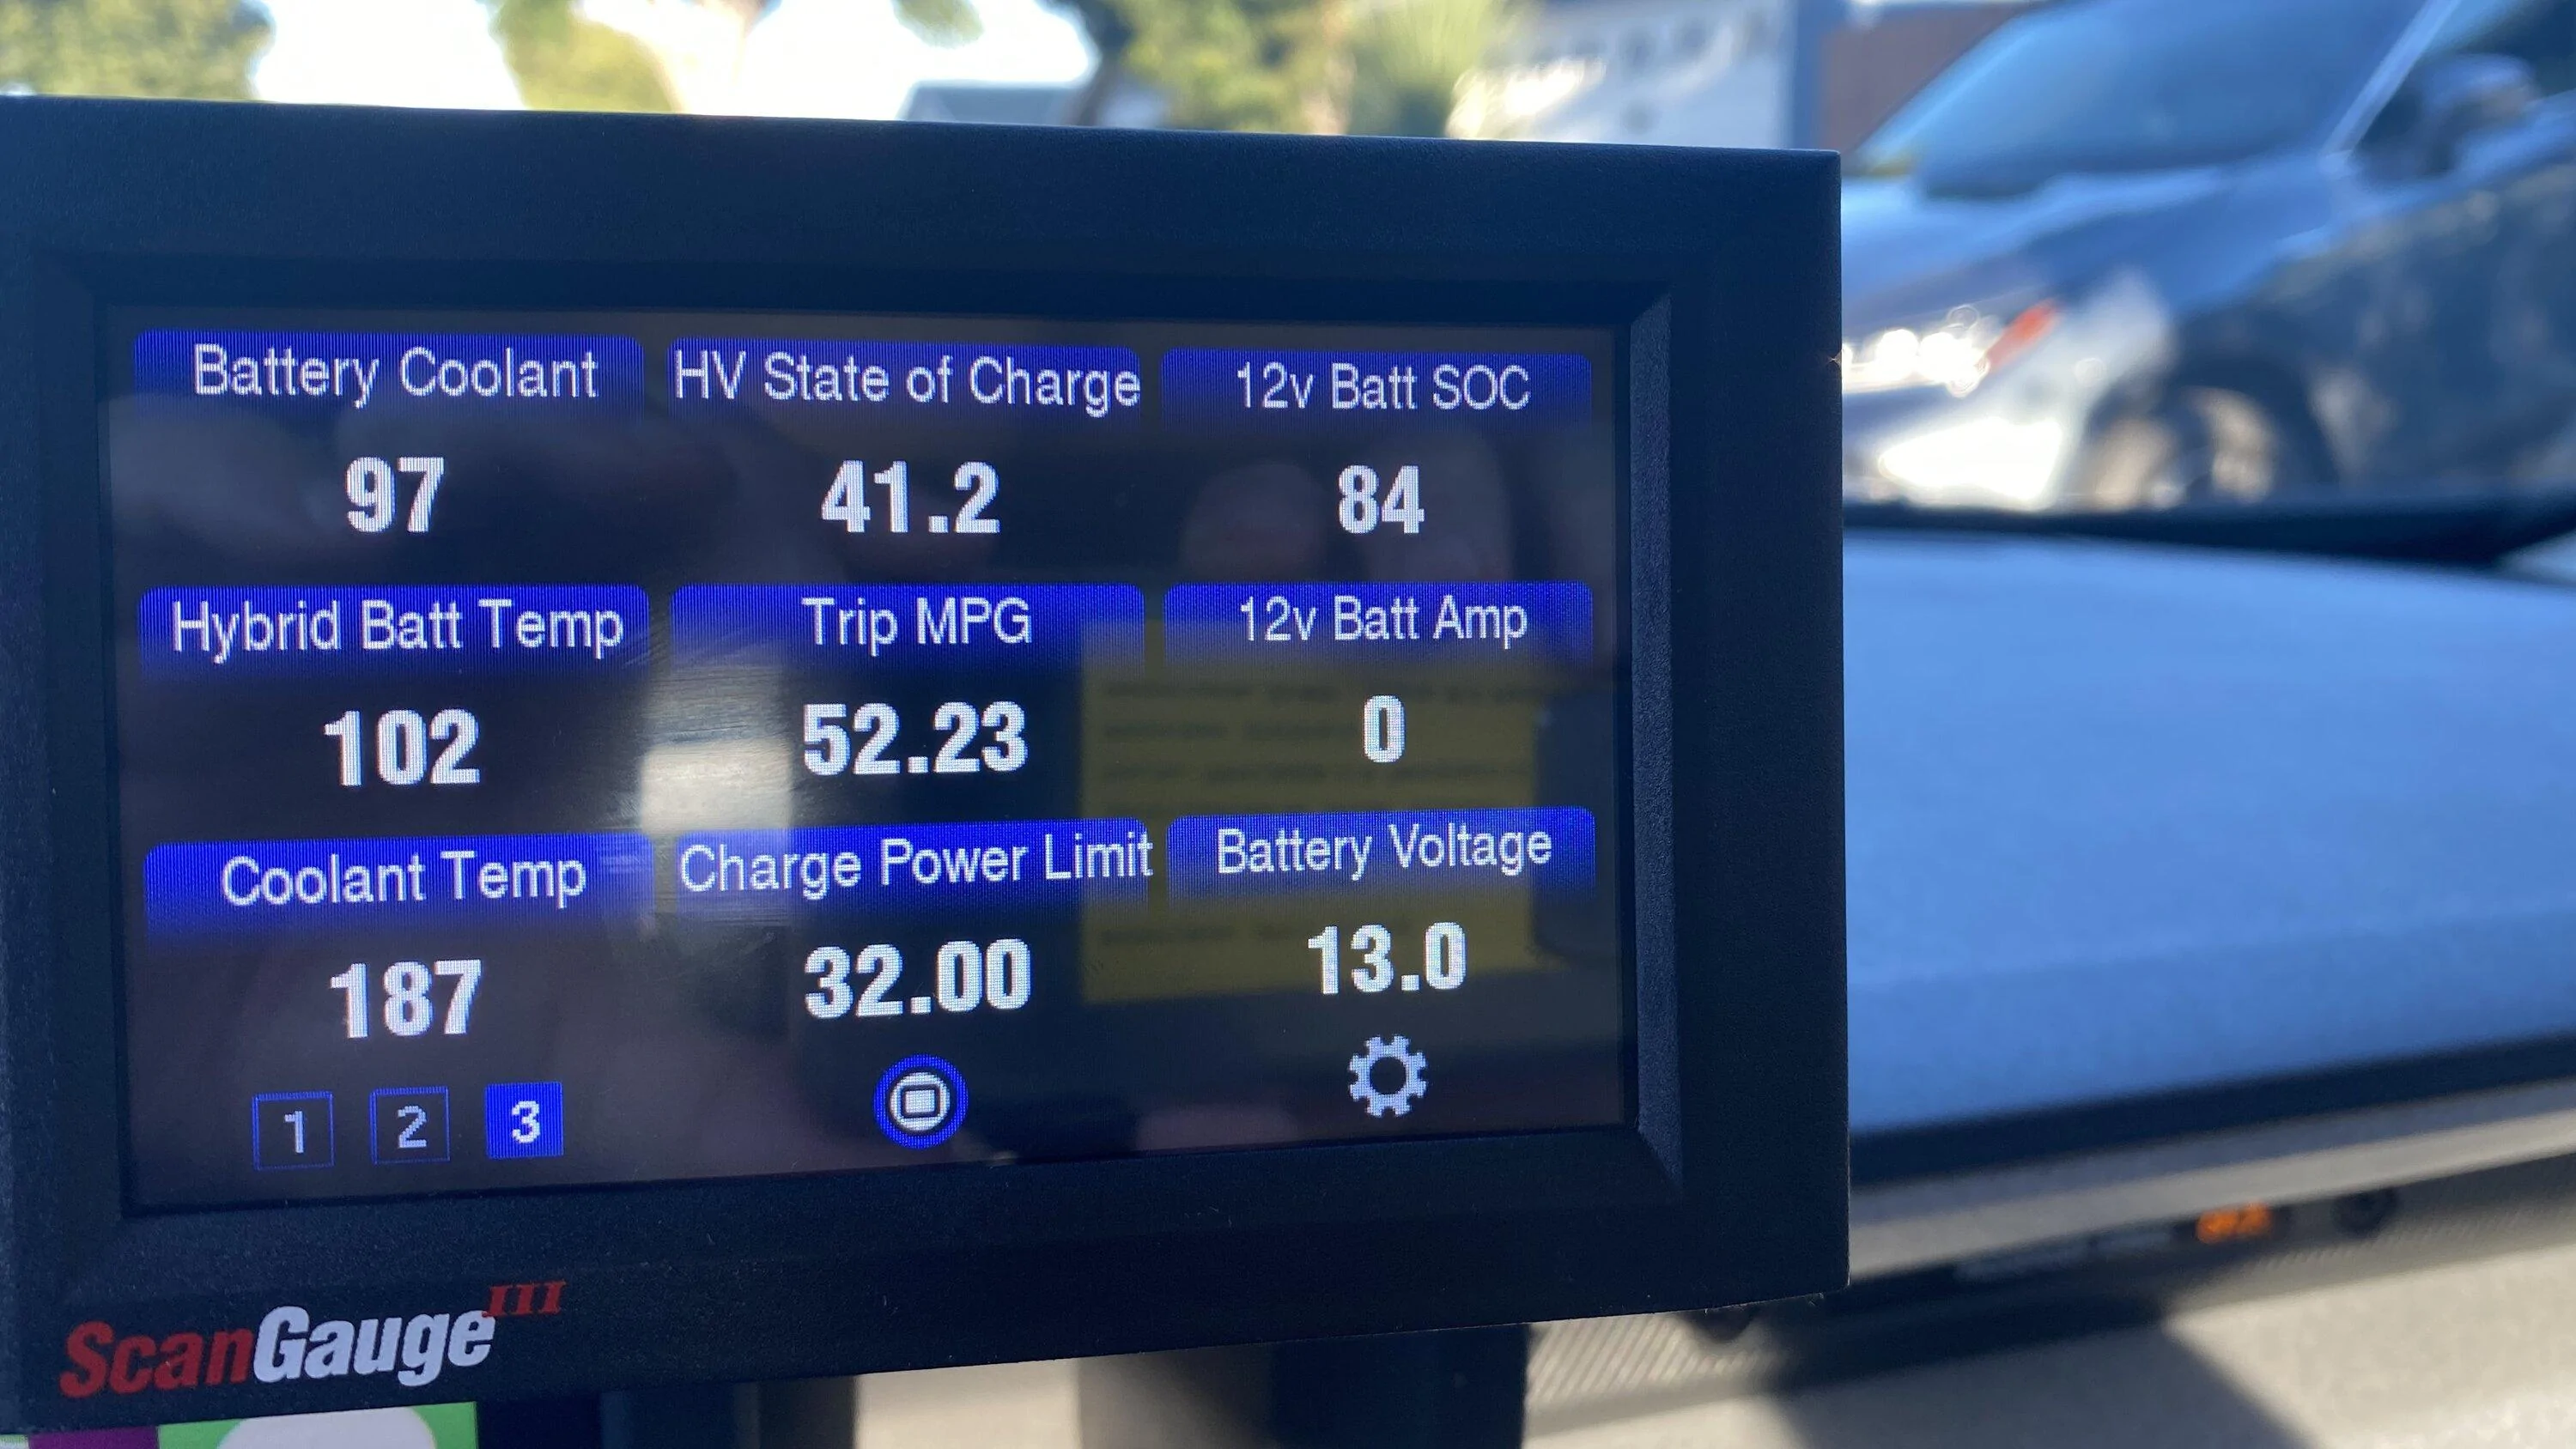
This is geared towards ScanGauge users, but the same, or perhaps other data may be observed using other software or hardware scanners. I can add additional lines to this table if additional PID's (parameters) are identified. Extras (perhapes utilized in Forscan) can also be programmed into ScanGauge devices.
This is a living, evolving document that will be updated and will get better and better over time.
Myself will take ownership of page one. New data from pages below will be added to these charts.
This way, members looking for fast, updated data, will only have to look at the top post and will not have to read though hundrends of posts that will eventually evolve.
Thanks in advance for your participation. This will help that age old question: "Is my truck normal?"
-John
Due to differences of opinion, site administrator has temporarily suspended my ability to make new posts, without defining the length of "temporary". I think I accidentally offended someone. Well I'm deeply sorry to anyone offended. I'll keep adding data here; when able.
FOOTNOTES:
1. Open, Closed, or NA. Open is when a cold engine is running from a table of A/F ratios. Closed is when a warm engine is running from actual sensor data. NA is displayed in EV mode.
2. Believed to be maximum expected combined torque of the Hybrid Power Train. Engine plus Motor is expected to be no more than this. Experimental observations add up to about this number.
This is geared towards ScanGauge users, but the same, or perhaps other data may be observed using other software or hardware scanners. I can add additional lines to this table if additional PID's (parameters) are identified. Extras (perhapes utilized in Forscan) can also be programmed into ScanGauge devices.
This is a living, evolving document that will be updated and will get better and better over time.
Myself will take ownership of page one. New data from pages below will be added to these charts.
This way, members looking for fast, updated data, will only have to look at the top post and will not have to read though hundrends of posts that will eventually evolve.
Thanks in advance for your participation. This will help that age old question: "Is my truck normal?"
-John
Due to differences of opinion, site administrator has temporarily suspended my ability to make new posts, without defining the length of "temporary". I think I accidentally offended someone. Well I'm deeply sorry to anyone offended. I'll keep adding data here; when able.
| Things ScanGaugeIII will MEASURE | ||||
| Min | Max | |||
| Observed | Observed | Footnotes | ||
| 12v Batt Amp | A | -33 | 50 | |
| 12v Batt SOC | % | 0 | 99 | |
| A/F Ratio B1S1 | :1 | |||
| A/F Ratio Commanded | :1 | |||
| Absolute Load | % | 75 | ||
| Ambient Temp | F | 34 | 106 | |
| Barometric Pressure | PSI | |||
| Battery Coolant | F | 44 | 118 | |
| Battery Voltage 12v | V | 11.7 | 15.4 | |
| Boost Pressure (EB) or Vac | PSI | -8 | ||
| Cam Timing | Deg | |||
| Cam Timing 2 | Deg | |||
| Cat Temp B1S1 | F | |||
| Charge Power Limit | kW | 0 | 32 | |
| Coolant Temp (CHT) | F | 40 | 215 | |
| Cyl Head Temp (CT) | F | 40 | 215 | |
| EBP Bank 1 Exhaust Pressure | PSI | 14.6 | 14.8 | |
| EGR A % Duty Cycle or % | % | |||
| EGR B2S1 Temp | F | |||
| Engine Load | % | |||
| Engine RPM | RPM | 0 | 5626 | |
| Engine Torque | lb/ft | 0 | 149 | |
| Evap Pres A (wide) | Pa | |||
| Evap Pres B (wide) | Pa | |||
| Fan Speed Desired | % | 0 | 0 | |
| Fuel Flow | GPH | |||
| Fuel Level | % | |||
| Fuel Loop | O/C | Open | Closed | 1. |
| Gen Coil Temp | F | 50 | 259 | |
| Gen Inverter Temp | F | 50 | 165 | |
| Gen Inverter Volt | V | Same as | Battery | |
| Gen Speed | RPM | 0 | 11500 | |
| Gen Torque | Nm | |||
| Gross Horsepower | HP | 0 | 198 | |
| HEV Battery Current | A | |||
| HEV Battery Power | W | |||
| HEV Battery Voltage | V | 235 | ||
| HV min module V | V | |||
| HV State of Charge | % | 28 | 72 | |
| Hybrid Battery Amps | A | 150 | ||
| Hybrid Battery Temp | F | 44 | 112 | |
| Hybrid Battery Volts | V | 208 | 235 | |
| Hybrid State | ||||
| IAT B1S1 | F | |||
| Ignition Timing | Deg | |||
| Instant MPG | MPG | 0 | 9999 | |
| Intake Temp | F | |||
| LTFT 2nd O2 B1 "Secondary" | % | |||
| LTFT Bank 1 | % | |||
| Manifold Pressure Absolute | PSI | |||
| Mod delta p (t) | T | |||
| Motor Coil Temperture | F | 40 | 165 | |
| Motor Inverter Temp | F | |||
| Motor Inverter Volt | V | |||
| Motor Speed | RPM | 0 | 9750 | |
| Motor Torque | Nm | 238 | ||
| O2 B1S1 mA | mA | |||
| O2 B1S2 Scaled | % | |||
| Oil Life | % | 0 | 99 | |
| Reference Torque | lb/ft | 245.6 | 245.6 | 2. |
| Relative Throttle | % | |||
| Speed | MPH | 0 | 78 | |
| STFT B1S2 | % | |||
| STFT Bank 1 | % | |||
| Throttle Position Absolute | % | |||
| Tire Pressures 1-2-3-4 | PSI | 33 | 49 | |
| Transmission Temperture | F | 40 | 149 | |
| TRQ % Actual - Engine | % | |||
FOOTNOTES:
1. Open, Closed, or NA. Open is when a cold engine is running from a table of A/F ratios. Closed is when a warm engine is running from actual sensor data. NA is displayed in EV mode.
2. Believed to be maximum expected combined torque of the Hybrid Power Train. Engine plus Motor is expected to be no more than this. Experimental observations add up to about this number.
Sponsored
Last edited: