- First Name
- Steve
- Joined
- Jul 21, 2021
- Threads
- 56
- Messages
- 2,754
- Reaction score
- 4,699
- Location
- coppell tx
- Vehicle(s)
- 2023 Ford Maverick Hybrid
- Engine
- 2.5L Hybrid
- Thread starter
- #1
Many people got spoiled with the extremely low or even 0% loan rates that were recently offered.
Those rates were unnaturally pushed down because of shocks to the financial system.
Now rates have moved to a more balanced market.
For reference here is a look at the Historical Auto Loan Rates since 1972
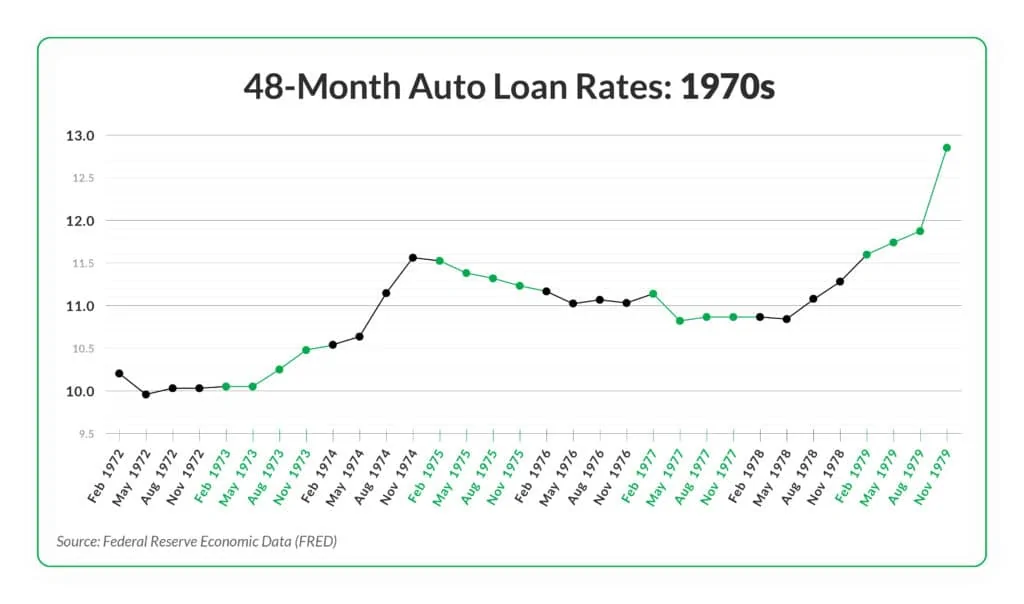
Rates in the 1970's were consistently above 10% hitting a peak of 11.57% in November 1974
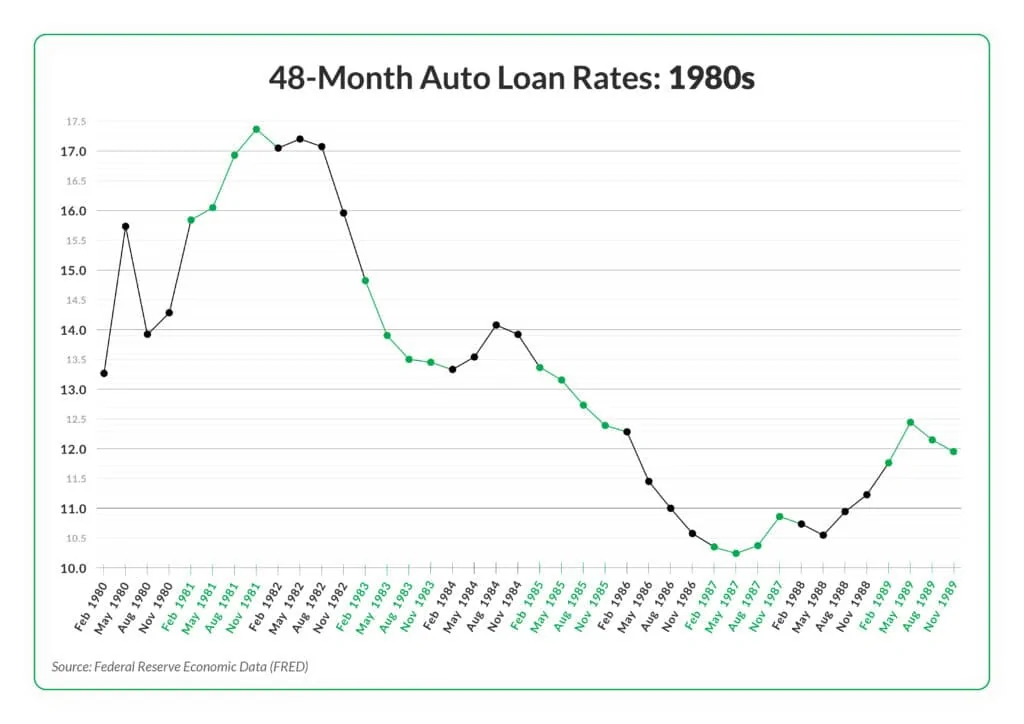
Rates in the 1980's were consistently above 10% hitting a peak of 17.36% by November 1981
Rates in the 1990's ranged from 11.6% in February 1991 to a low of 7.54% in February 1994. Although they would climb again to reach 9.78% in May 1995, they never crested 10%. For the rest of the decade, auto loan rates hung between 8.31% and 9.44%.
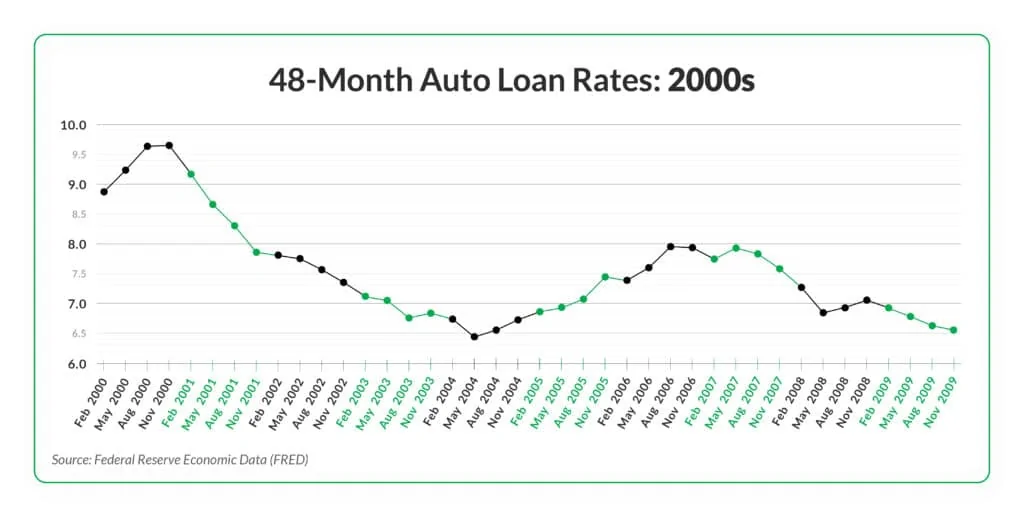
Rates in the 2000's ranged from 9.64% in November 2000 to 6.43% by May 2004
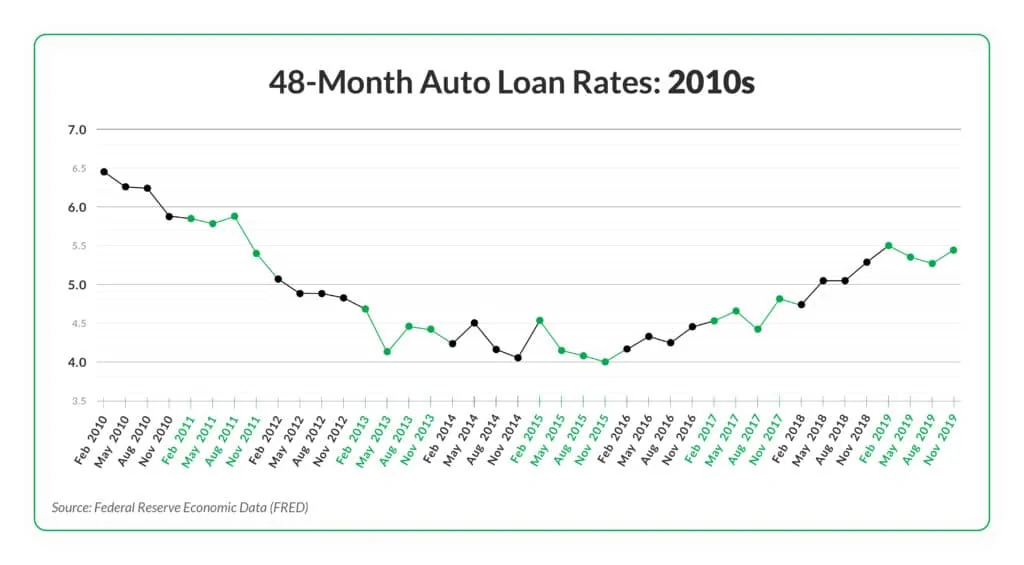
Rates in the 2010's were at their highest in 2011, peaking at 5.89% in August before falling to exceptionally low levels for the first half of the decade. There were moments of slight volatility between 2013 and 2015: Rates sat at 4.13% in May 2013, then rose to 4.5% a year later, immediately sank to 4.06% in November 2014, and then jumped back up to 4.53% by February 2015.
Auto loan rates hit their all-time lowest point in November 2015 at an even 4%. By 2019
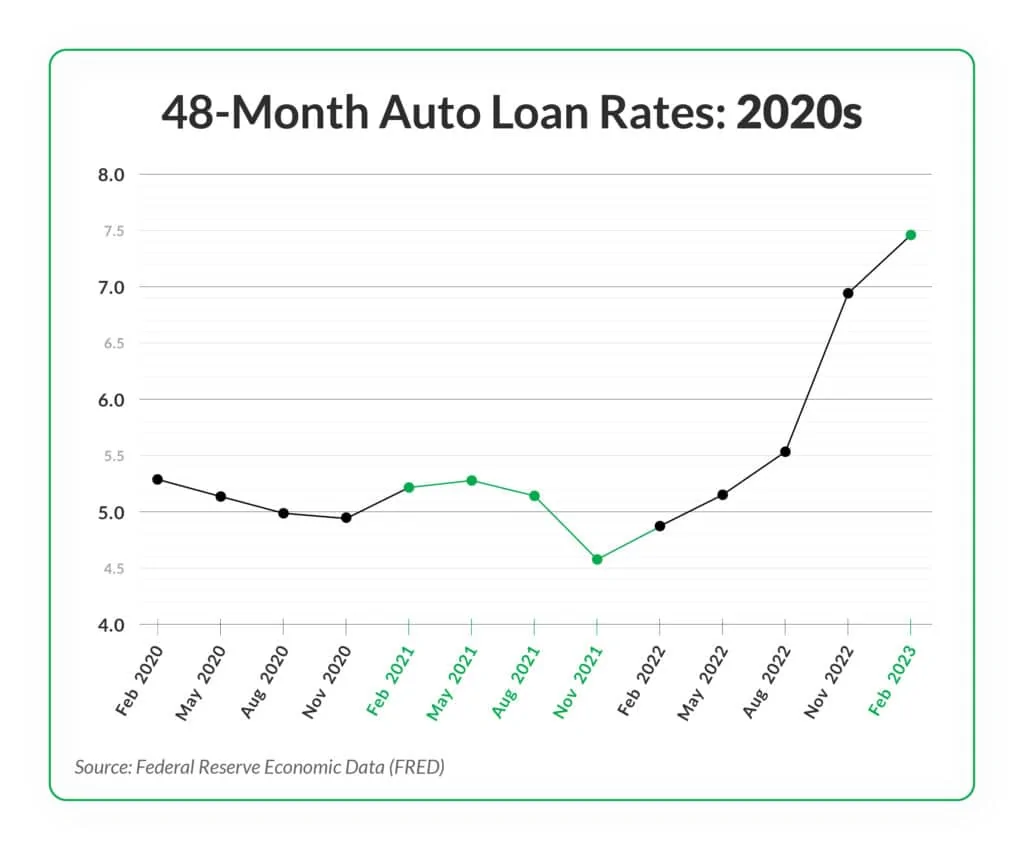
2020-2023 Auto loan rates were significantly influenced by the COVID-19 pandemic and the effect it had on the U.S. economy. Rates started off relatively low in 2020 and continued to decline in the first year of the pandemic. Once the world began to recover, auto loan rates skyrocketed, climbing to 6.94% by November 2022. As of February 2023, which is the most recent data collected by the Fed, rates sat at 7.46%.
Historical Auto Loan Rates
The Fed began tracking auto loan rates for new cars with 48-month loan terms in February 1972. We’ll summarize the FRED findings by decade below.
1972-1979
When the Fed first began tracking this data in February 1972, auto loan rates sat at 10.2%. They hovered consistently around 10% until about May 1973. The 1973-1975 recession saw rates slowly begin to rise as the country dealt with issues like high inflation, high unemployment and a global stock market crash. Rates peaked at 11.57% in November 1974, and it took several years for them to drop below 11% again.
As the U.S. continued to face high inflation following the recession, this led to a sharper increase in auto loan rates toward the end of the 1970s.
1980-1989
The 1980s started with auto loan rates at an all-time high, reaching a record 17.36% by November 1981. The early ‘80s was a period marked by extreme economic contraction, with the country facing another recession in 1981-1982. Monetary policy focused on controlling the inflation left over from the 1970s, and the Fed raised interest rates to combat this sky-high inflation, leading to high auto loan rates.
By November 1982, rates had begun to come down, dropping 1.39 points from the year before to 15.97%. The downward trend continued through much of the ‘80s as rates saw a relatively steady decline, reaching a low of 10.23% in May 1987. Rates would climb back up to 12.44% by May 1989 but would begin to wane almost immediately.
1990-1999
In August 1990, Iraq invaded Kuwait, causing what’s now referred to as the 1990 oil price shock. A sudden rise in oil prices triggered a mild recession in the U.S., which caused loan rates to remain fairly high at the start of the ‘90s.
However, the recession was short-lived. It ended in March 1991, and the U.S. saw a drastic reduction in auto loan rates following its conclusion. They decreased from 11.6% in February 1991 to a low of 7.54% in February 1994. Although they would climb again to reach 9.78% in May 1995, they never crested 10%. For the rest of the decade, auto loan rates hung between 8.31% and 9.44%.
2000-2009
The early 2000s was another period of decline for new car loan rates, decreasing from 9.64% in November 2000 to 6.43% by May 2004. The 2001 New York City terrorist attack played a significant role in this decline, but rates began to steadily rise again starting in 2004.
The increase in rates continued until the Great Recession struck the economy in 2008, causing a sharp, rapid drop in new automobile loan rates. At the beginning of the downturn, rates stood at 7.27% — by May 2009, they had dropped to 6.79%.
2010-2019
As the economy began to recover in 2010, auto loan rates continued to fall, sinking to 5.87% by November of that year. Rates were at their highest in 2011, peaking at 5.89% in August before falling to exceptionally low levels for the first half of the decade. There were moments of slight volatility between 2013 and 2015: Rates sat at 4.13% in May 2013, then rose to 4.5% a year later, immediately sank to 4.06% in November 2014, and then jumped back up to 4.53% by February 2015.
Auto loan rates hit their all-time lowest point in November 2015 at an even 4%. By 2019, they’d climbed up 1.5%, only to begin falling once the COVID-19 pandemic struck in early 2020.
2020-2023
Auto loan rates were significantly influenced by the COVID-19 pandemic and the effect it had on the U.S. economy. Rates started off relatively low in 2020 and continued to decline in the first year of the pandemic. Once the world began to recover, auto loan rates skyrocketed, climbing to 6.94% by November 2022. As of February 2023, which is the most recent data collected by the Fed, rates sat at 7.46%.
Historical Auto Loan Rates: 60-Month Loans
The Fed only started collecting data on 60-month loans for new cars in August 2006, so the available information isn’t nearly as extensive as it is for 48-month loans.
2006-2009
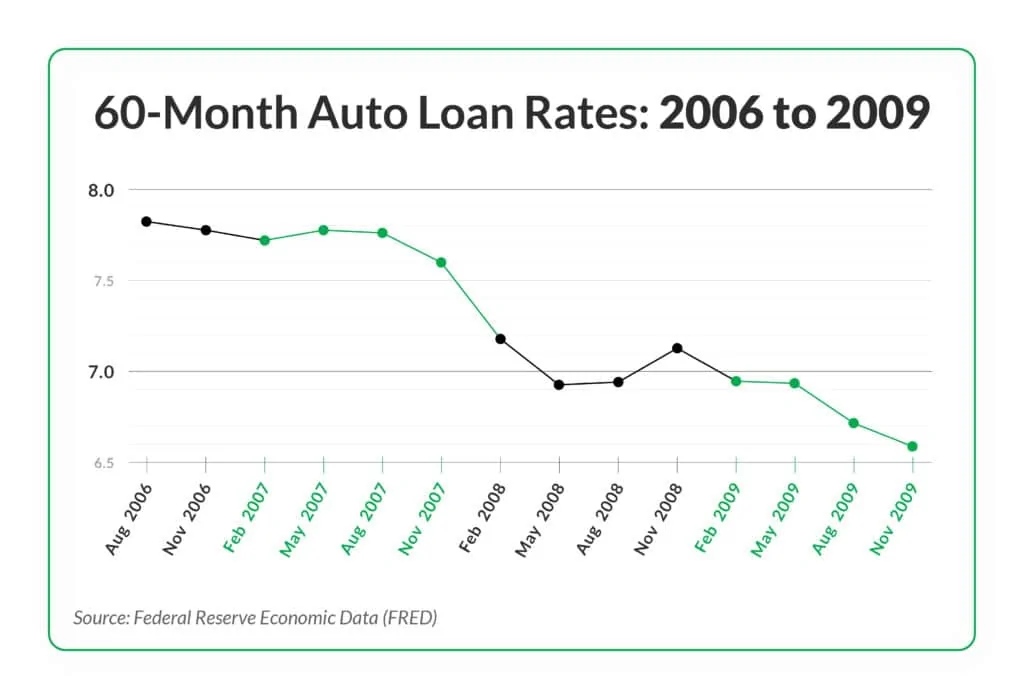
Auto loan rates saw a relatively steady decline from 2006 to 2009, falling from a high of 7.82% in August 2006 to 6.59% in November 2009. The steepest drop occurred between November 2007 and February 2008, when rates fell from 7.6% to 7.18%. During the Great Recession, rates settled around 7% but began falling gradually as the markets recovered.
2010-2019
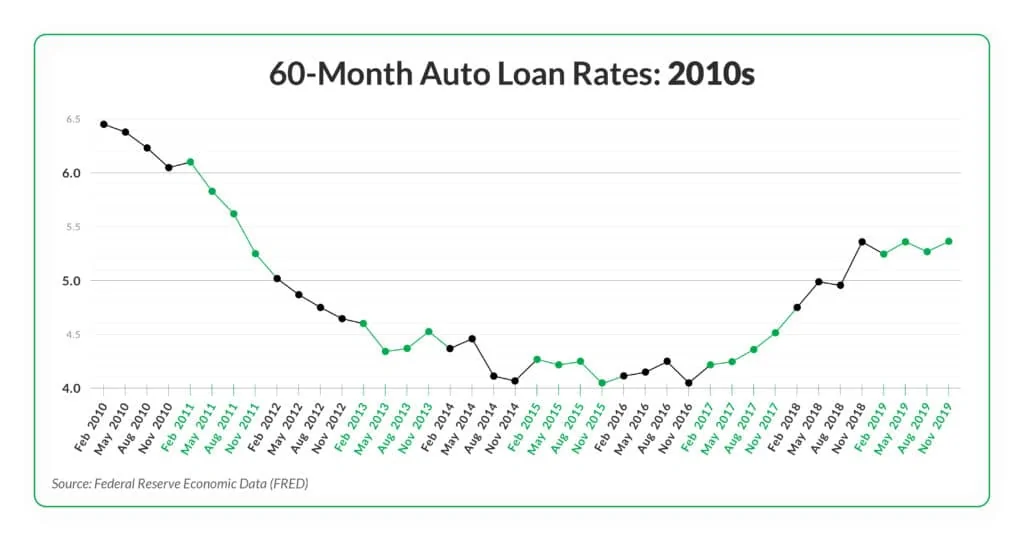
In the 2010s, 60-month auto loans rates saw a similar pattern to 48-month rates, declining steadily for the first four years to a low of 4.05% in November 2015. Rates stayed relatively consistent over the next year, until they began creeping back up in the following two years. From November 2016 to November 2018, rates climbed more than a percentage point from 4.05% to 5.36%. They remained right around that level through the end of 2019, just before the start of the COVID-19 pandemic.
2020-2023
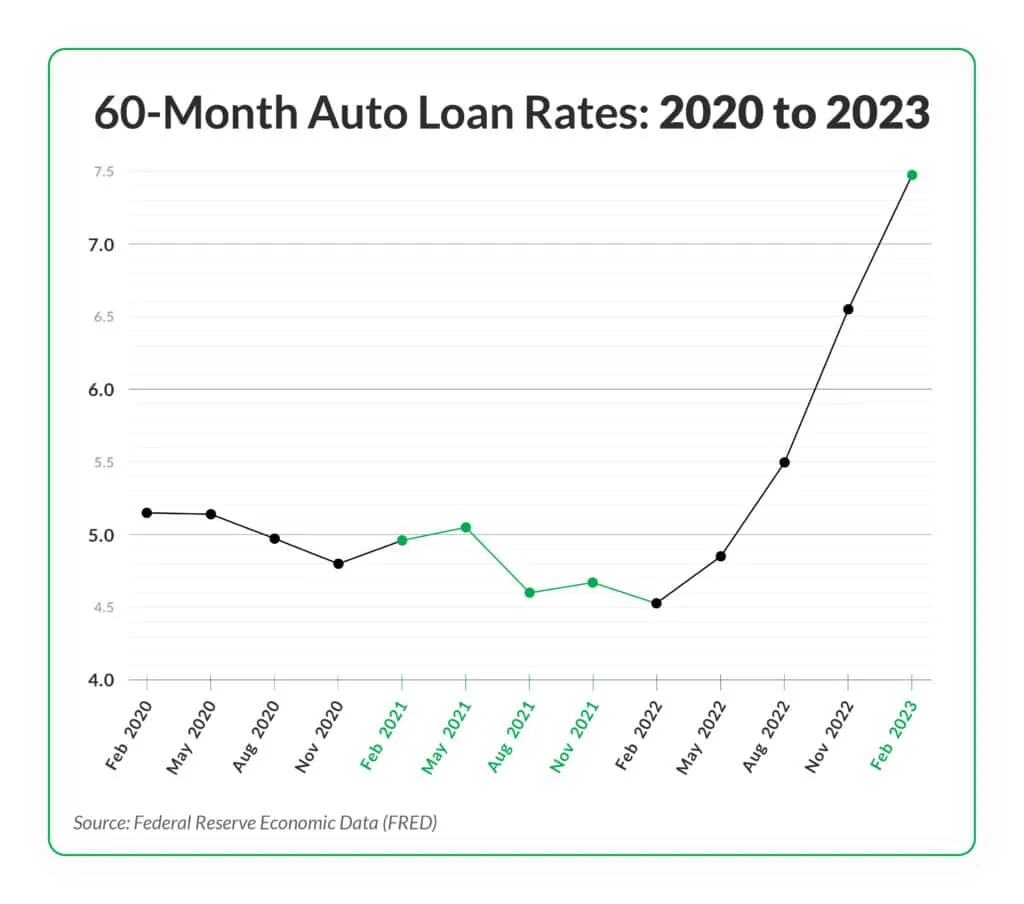
As the Fed cut interest rates in response to the economic effects of the COVID-19 pandemic, auto loan rates began a steady decline through all of 2020. While there were slight changes throughout 2021 and early 2022, rates for 60-month loans stayed between 4.52% (February 2022) and 5.05% (May 2021). By August 2022, rates had climbed to 5.5% and began to rise significantly, hitting 7.48% by February 2023.
Historical Auto Loan Rates: 72-Month Loans
The Fed’s data for 72-month loans on new cars is the most limited, starting in August 2015.
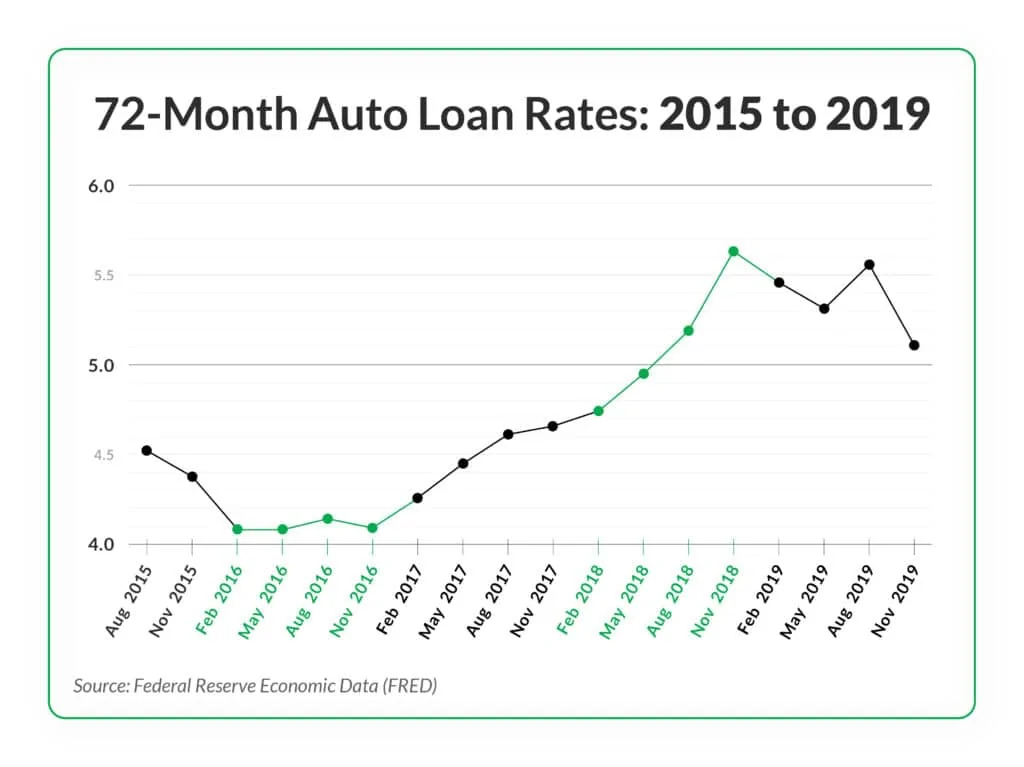
2015-2019
When the Fed first started collecting data on 72-month loans for new autos in August 2015, rates stood at 4.52%. By May of 2016, they’d declined by 0.44 percentage points, landing at 4.08%. From there, rates began a steady rise for most of the remainder of the decade, topping off at 5.63% in November 2018. From there, they stayed between 5% and 5.5% throughout 2019.
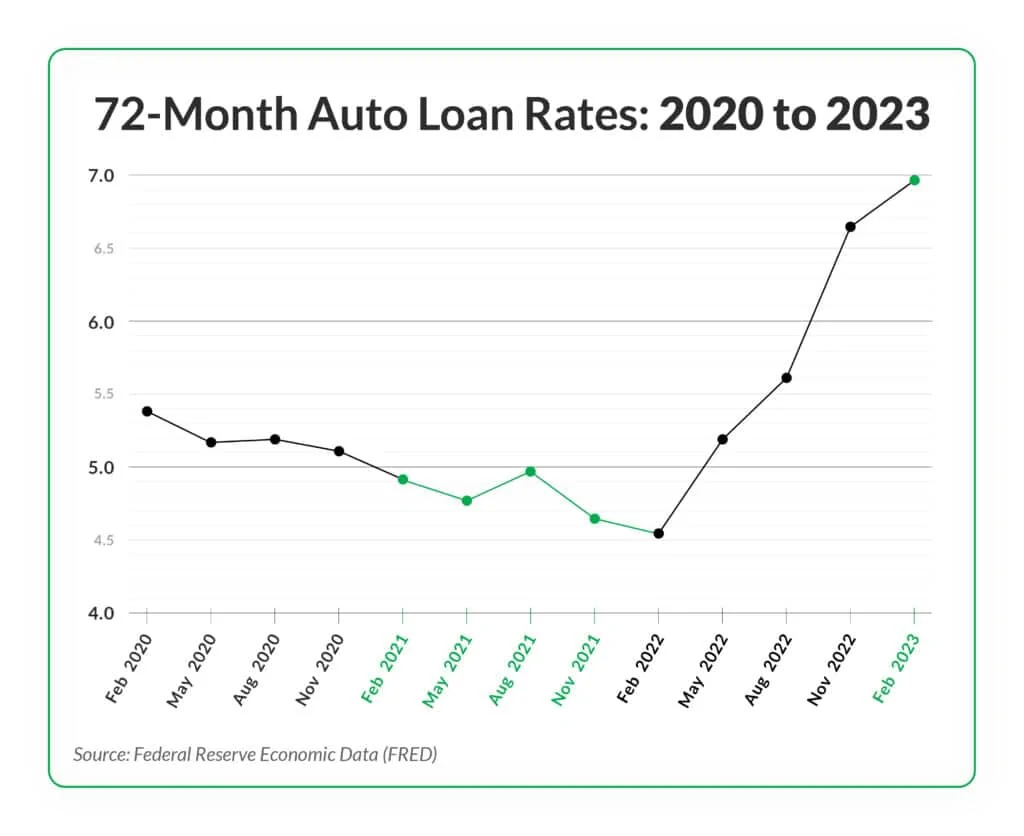
2020-2023
Similar to rates for all other loan terms, 72-month loan rates experienced a drop throughout 2020 and remained low for most of 2021 and early 2022. Rates didn’t rise above 5% again until May 2022, when they reached 5.19%. From there, they increased every few months, reaching 6.97% in February 2023.
How Did the COVID-19 Pandemic Impact Auto Loan Rates?
Based on Federal Reserve data, auto loan rates experienced a decline during 2020 following the start of the COVID-19 pandemic. This is due in part to the fact that the Fed drastically lowered interest rates to help stabilize the economy during that time. Rates remained low throughout 2021 and early 2022 as the country looked to recover from the economic challenges it faced in an ongoing pandemic.
However, as the U.S. dealt with rising inflation, the Federal Reserve began to take steps in 2022 to counteract it. March 2022 marked the beginning of a series of rate hikes in which the Fed raised rates by five percentage points, with the most recent increase occurring in May 2023.

Those rates were unnaturally pushed down because of shocks to the financial system.
Now rates have moved to a more balanced market.
For reference here is a look at the Historical Auto Loan Rates since 1972
Rates in the 1970's were consistently above 10% hitting a peak of 11.57% in November 1974
Rates in the 1980's were consistently above 10% hitting a peak of 17.36% by November 1981
Rates in the 1990's ranged from 11.6% in February 1991 to a low of 7.54% in February 1994. Although they would climb again to reach 9.78% in May 1995, they never crested 10%. For the rest of the decade, auto loan rates hung between 8.31% and 9.44%.
Rates in the 2000's ranged from 9.64% in November 2000 to 6.43% by May 2004
Rates in the 2010's were at their highest in 2011, peaking at 5.89% in August before falling to exceptionally low levels for the first half of the decade. There were moments of slight volatility between 2013 and 2015: Rates sat at 4.13% in May 2013, then rose to 4.5% a year later, immediately sank to 4.06% in November 2014, and then jumped back up to 4.53% by February 2015.
Auto loan rates hit their all-time lowest point in November 2015 at an even 4%. By 2019
2020-2023 Auto loan rates were significantly influenced by the COVID-19 pandemic and the effect it had on the U.S. economy. Rates started off relatively low in 2020 and continued to decline in the first year of the pandemic. Once the world began to recover, auto loan rates skyrocketed, climbing to 6.94% by November 2022. As of February 2023, which is the most recent data collected by the Fed, rates sat at 7.46%.
Historical Auto Loan Rates
Historical Auto Loan Rates: 48-Month LoansAuto loan rates have fluctuated significantly since 1972, when the Federal Reserve began tracking historical data. In this article, we at the MarketWatch Guides Team take a closer look at rate trends by decade, considering data collected by the Federal Reserve. We’ll also explore the effect the COVID-19 pandemic had on car loan rates and dive into experts’ opinions on what we might be able to expect the Fed to do in the next year.
Key Takeaways:
- Auto loan rates for new cars were at their highest in the 1980s, when they hit 17.36% in November of 1981.
- Over the years, recessions and a global pandemic contributed to the volatility of loan rates.
- Economic experts don’t expect the Fed to lower interest rates until 2024.
The Fed began tracking auto loan rates for new cars with 48-month loan terms in February 1972. We’ll summarize the FRED findings by decade below.
1972-1979
When the Fed first began tracking this data in February 1972, auto loan rates sat at 10.2%. They hovered consistently around 10% until about May 1973. The 1973-1975 recession saw rates slowly begin to rise as the country dealt with issues like high inflation, high unemployment and a global stock market crash. Rates peaked at 11.57% in November 1974, and it took several years for them to drop below 11% again.
As the U.S. continued to face high inflation following the recession, this led to a sharper increase in auto loan rates toward the end of the 1970s.
1980-1989
The 1980s started with auto loan rates at an all-time high, reaching a record 17.36% by November 1981. The early ‘80s was a period marked by extreme economic contraction, with the country facing another recession in 1981-1982. Monetary policy focused on controlling the inflation left over from the 1970s, and the Fed raised interest rates to combat this sky-high inflation, leading to high auto loan rates.
By November 1982, rates had begun to come down, dropping 1.39 points from the year before to 15.97%. The downward trend continued through much of the ‘80s as rates saw a relatively steady decline, reaching a low of 10.23% in May 1987. Rates would climb back up to 12.44% by May 1989 but would begin to wane almost immediately.
1990-1999
In August 1990, Iraq invaded Kuwait, causing what’s now referred to as the 1990 oil price shock. A sudden rise in oil prices triggered a mild recession in the U.S., which caused loan rates to remain fairly high at the start of the ‘90s.
However, the recession was short-lived. It ended in March 1991, and the U.S. saw a drastic reduction in auto loan rates following its conclusion. They decreased from 11.6% in February 1991 to a low of 7.54% in February 1994. Although they would climb again to reach 9.78% in May 1995, they never crested 10%. For the rest of the decade, auto loan rates hung between 8.31% and 9.44%.
2000-2009
The early 2000s was another period of decline for new car loan rates, decreasing from 9.64% in November 2000 to 6.43% by May 2004. The 2001 New York City terrorist attack played a significant role in this decline, but rates began to steadily rise again starting in 2004.
The increase in rates continued until the Great Recession struck the economy in 2008, causing a sharp, rapid drop in new automobile loan rates. At the beginning of the downturn, rates stood at 7.27% — by May 2009, they had dropped to 6.79%.
2010-2019
As the economy began to recover in 2010, auto loan rates continued to fall, sinking to 5.87% by November of that year. Rates were at their highest in 2011, peaking at 5.89% in August before falling to exceptionally low levels for the first half of the decade. There were moments of slight volatility between 2013 and 2015: Rates sat at 4.13% in May 2013, then rose to 4.5% a year later, immediately sank to 4.06% in November 2014, and then jumped back up to 4.53% by February 2015.
Auto loan rates hit their all-time lowest point in November 2015 at an even 4%. By 2019, they’d climbed up 1.5%, only to begin falling once the COVID-19 pandemic struck in early 2020.
2020-2023
Auto loan rates were significantly influenced by the COVID-19 pandemic and the effect it had on the U.S. economy. Rates started off relatively low in 2020 and continued to decline in the first year of the pandemic. Once the world began to recover, auto loan rates skyrocketed, climbing to 6.94% by November 2022. As of February 2023, which is the most recent data collected by the Fed, rates sat at 7.46%.
Historical Auto Loan Rates: 60-Month Loans
The Fed only started collecting data on 60-month loans for new cars in August 2006, so the available information isn’t nearly as extensive as it is for 48-month loans.
2006-2009
Auto loan rates saw a relatively steady decline from 2006 to 2009, falling from a high of 7.82% in August 2006 to 6.59% in November 2009. The steepest drop occurred between November 2007 and February 2008, when rates fell from 7.6% to 7.18%. During the Great Recession, rates settled around 7% but began falling gradually as the markets recovered.
2010-2019
In the 2010s, 60-month auto loans rates saw a similar pattern to 48-month rates, declining steadily for the first four years to a low of 4.05% in November 2015. Rates stayed relatively consistent over the next year, until they began creeping back up in the following two years. From November 2016 to November 2018, rates climbed more than a percentage point from 4.05% to 5.36%. They remained right around that level through the end of 2019, just before the start of the COVID-19 pandemic.
2020-2023
As the Fed cut interest rates in response to the economic effects of the COVID-19 pandemic, auto loan rates began a steady decline through all of 2020. While there were slight changes throughout 2021 and early 2022, rates for 60-month loans stayed between 4.52% (February 2022) and 5.05% (May 2021). By August 2022, rates had climbed to 5.5% and began to rise significantly, hitting 7.48% by February 2023.
Historical Auto Loan Rates: 72-Month Loans
The Fed’s data for 72-month loans on new cars is the most limited, starting in August 2015.
2015-2019
When the Fed first started collecting data on 72-month loans for new autos in August 2015, rates stood at 4.52%. By May of 2016, they’d declined by 0.44 percentage points, landing at 4.08%. From there, rates began a steady rise for most of the remainder of the decade, topping off at 5.63% in November 2018. From there, they stayed between 5% and 5.5% throughout 2019.
2020-2023
Similar to rates for all other loan terms, 72-month loan rates experienced a drop throughout 2020 and remained low for most of 2021 and early 2022. Rates didn’t rise above 5% again until May 2022, when they reached 5.19%. From there, they increased every few months, reaching 6.97% in February 2023.
How Did the COVID-19 Pandemic Impact Auto Loan Rates?
Based on Federal Reserve data, auto loan rates experienced a decline during 2020 following the start of the COVID-19 pandemic. This is due in part to the fact that the Fed drastically lowered interest rates to help stabilize the economy during that time. Rates remained low throughout 2021 and early 2022 as the country looked to recover from the economic challenges it faced in an ongoing pandemic.
However, as the U.S. dealt with rising inflation, the Federal Reserve began to take steps in 2022 to counteract it. March 2022 marked the beginning of a series of rate hikes in which the Fed raised rates by five percentage points, with the most recent increase occurring in May 2023.
Sponsored
Last edited: